Update: weather, production, quality and logistics
Weekly banana market dashboard based on the Fyffes WK23 material: weather impact, regional quality updates, shipping plan and spot price overview.
Impact of the banana supply under SUPER NIÑO
Presentation summary from the El Niño banana outlook: a very strong Pacific warming scenario can shift wind and rainfall patterns, create drier and hotter Pacific-facing origins, increase humidity in Caribbean origins and raise supply, quality and planning risk for H2 2026.
Download original PPTX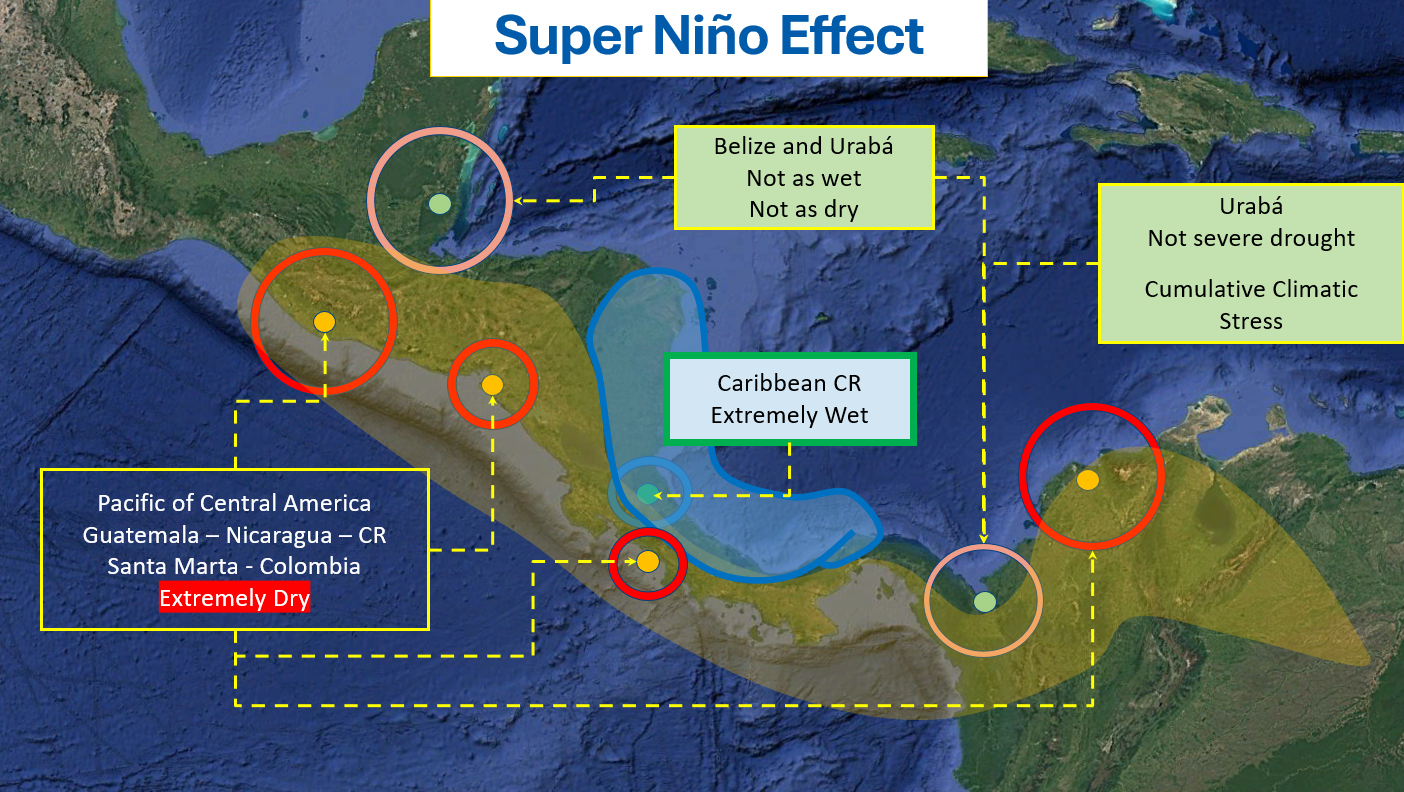 Weather models proof evidence of a Super Niño 2026/2027
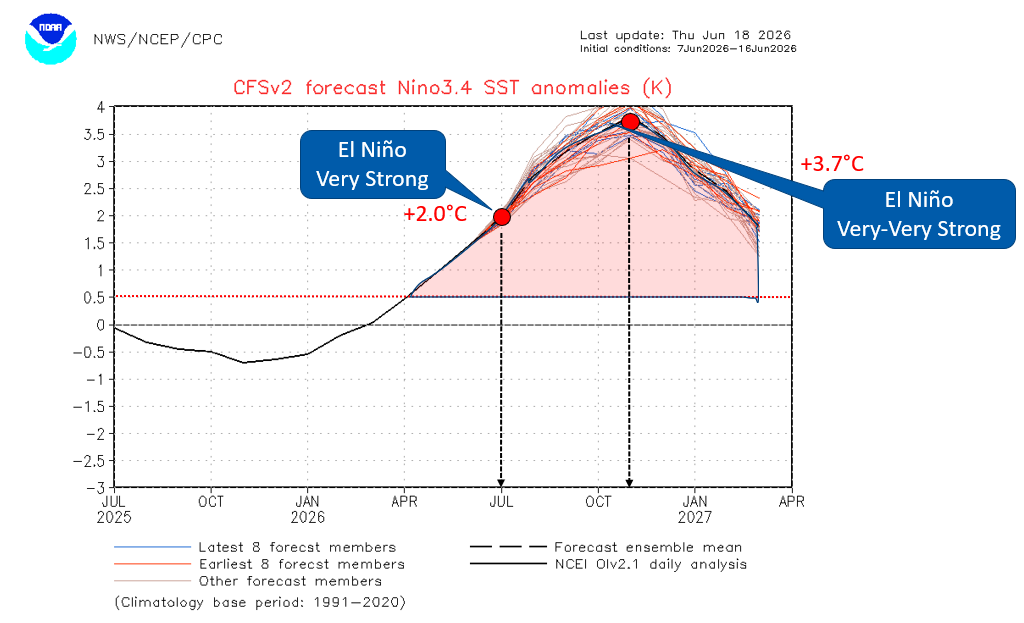
Multiple El Niño signals and strengthening into winter 2026/27 are expected to intensify regional climate disruption across LATAM.
Weather models proof evidence of a Super Niño 2026/2027
Multiple El Niño signals and strengthening into winter 2026/27 are expected to intensify regional climate disruption across LATAM.
El Niño vs La Niña: production mechanics
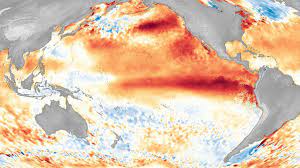
Measurements are based on water surface temperature along the Equator line, monitored between Australia and the Americas and compared with the historic average.
- El Niño: temperature increases from the average, causing warmer surface water and changing ocean-atmosphere interaction.
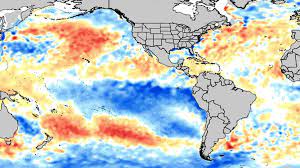
- La Niña: temperature decreases from the average, producing colder Central and Eastern Pacific surface temperature.
- Moderate events: temperature variation around +1.0°C / -1.0°C is monitored as a key threshold.
- Operational impact: wind, rainfall and temperature patterns shift across LATAM and other production areas.
Super Niño evidence and expected disruption
The outlook highlights the possibility of one of the strongest El Niño events in the last 30 years, with models indicating further strengthening into winter 2026/27.
- Fruit-growing conditions have already been under pressure from recurring El Niño and La Niña patterns.
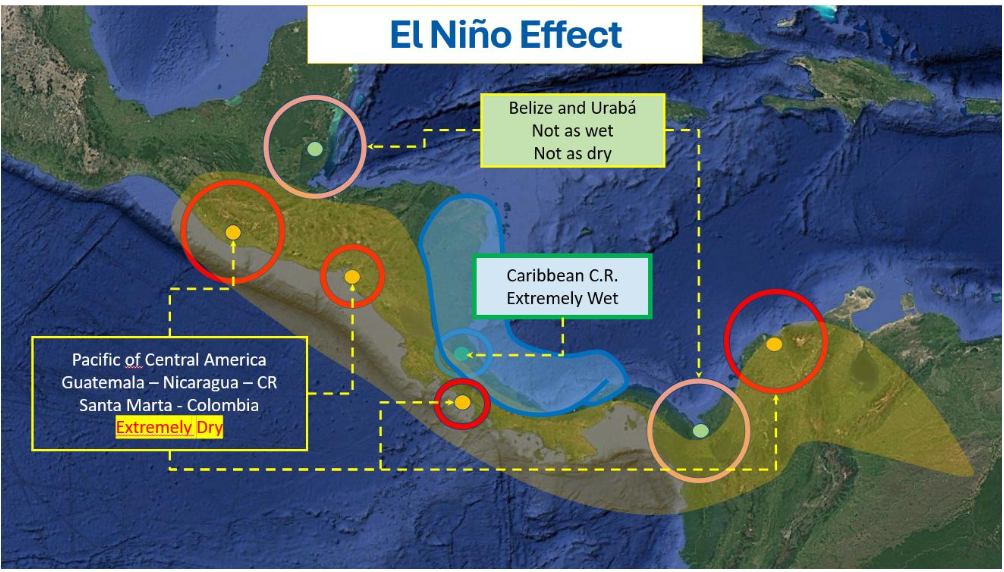
- The Pacific warming combined with cooler Caribbean water may create a pronounced Thermal Dipole.
- Expected outcomes include shifted wind and rainfall patterns, drier Pacific-facing origins and excessive rain/humidity in Caribbean origins.
Impact on banana production regions
Impact will vary by topography, microclimates and the actual El Niño evolution. The presentation calls out supply uncertainty, search for fruit in South and Central America and reputational pressure.
- Chiquita supply uncertainty as they search for fruit in South and Central America.
- 6,000 hectares remain uncultivated.
- Restart harvesting takes more than one year after return to farm practice.
- Conditions may vary significantly by production origin and microclimate.
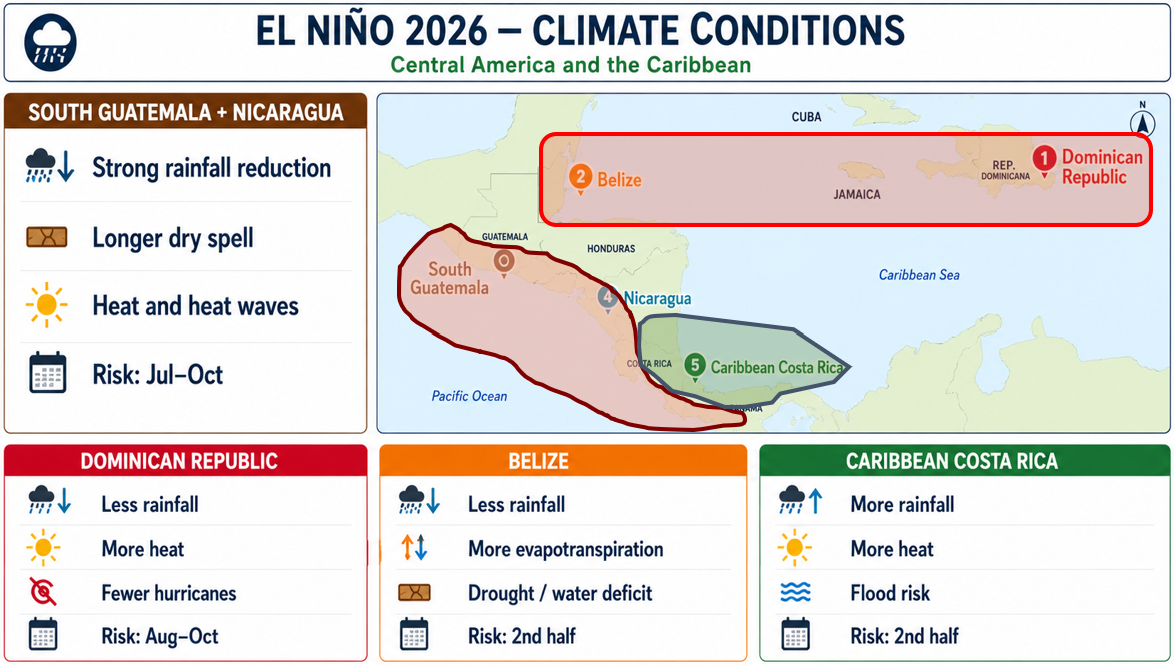
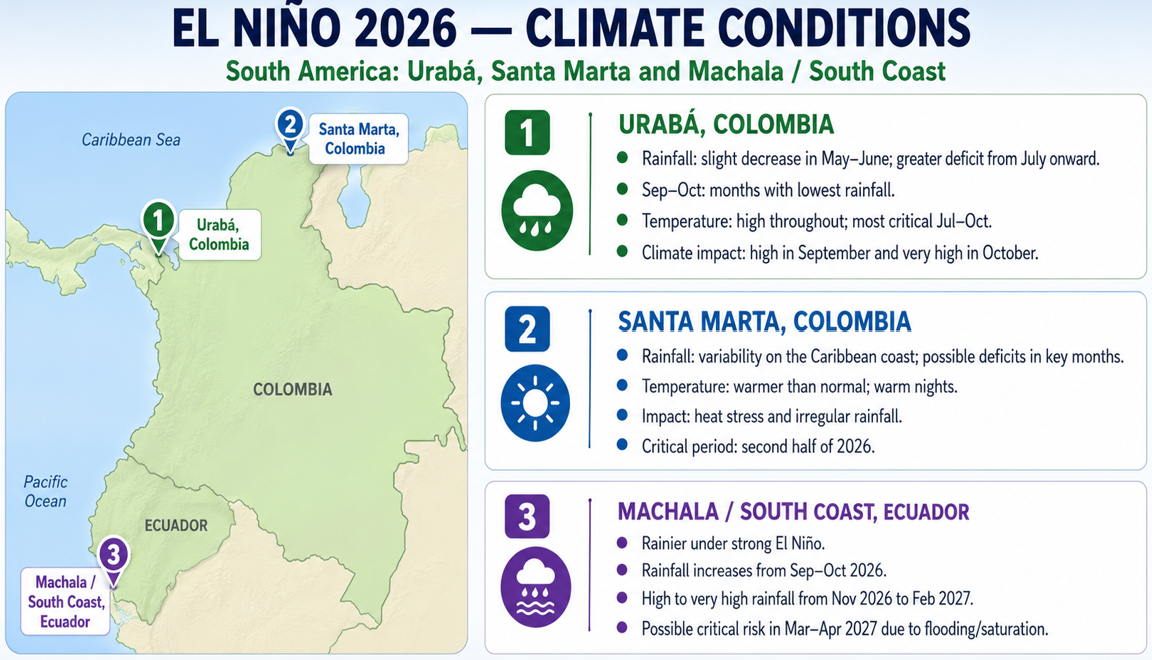
Climate impact — H2 2026
The productive impact by origin is not homogeneous. Dry zones and wet zones carry different agronomic and operational risks.
- Dry zones: higher risk on shooting, filling, weight and grade.
- Wet zones: greater phytosanitary, operational and quality pressure.
- Origin-by-origin climate risk outlook should guide agronomic actions and customer planning.
| Zone / Origin | Expected production impact |
|---|---|
| ● Belize |
|
| ● Guatemala Pacific |
|
| ● Nicaragua |
|
| ● Santa Marta |
|
| ● Costa Rica Caribbean |
|
| ● Panama |
|
| ● Ecuador |
|
| ● Urabá |
|
Weather impact in fruit condition
Monitoring by origin shows recovery in some areas, while Colombia Santa Marta and Urabá remain important watch points for grade, curvature and Sigatoka pressure.
El Niño impact on banana production
- Strong El Niño event developing, with Pacific temperatures potentially reaching +3.5°C above normal.
- Changing weather patterns increase drought and rainfall risks across growing regions.
- Bananas face smaller fruit, lighter bunch weights and greater disease susceptibility.
- June–October remains a critical period for elevated production risk.
Impact of Weather in Fruit Condition 2026
HTML version of the weather matrix from the second slide. Green = good grade / low curvature, yellow = reduction in fruit grade, red = low grade / high curvature.
| Arrival week | 13 | 14 | 15 | 16 | 17 | 18 | 19 | 20 | 21 | 22 | 23 | 24 | 25 |
|---|---|---|---|---|---|---|---|---|---|---|---|---|---|
| Packing week | 10 | 11 | 12 | 13 | 14 | 15 | 16 | 17 | 18 | 19 | 20 | 21 | 22 |
| Dom. Rep | |||||||||||||
| Belize PMS | |||||||||||||
| Belize BGA | |||||||||||||
| Guatemala Sur | |||||||||||||
| Guatemala Norte | |||||||||||||
| Honduras | |||||||||||||
| Nicaragua | |||||||||||||
| Costa Rica | |||||||||||||
| Panamá | |||||||||||||
| Colombia-Urabá | |||||||||||||
| Colombia-Santa Marta | |||||||||||||
| Ecuador | |||||||||||||
| Peru |
Climatic Conditions
Colombia-Urabá is slowly recovering grade and improving Sigatoka conditions.
Colombia-Santa Marta (Bonasan) remains with low-grade gain and Sigatoka pressure.
Banana plantation weather context
Operational table explaining how weather deviations can influence production and fruit condition.
| Weather factor | Optimal / reference | Current risk interpretation | Fruit / production impact |
|---|---|---|---|
| Rainfall | ≈ 52mm per week | Watch | Too much or too little rain affects fruit growth, bunch weight and harvest consistency. |
| Humidity | Stable humidity, no prolonged excess | Risk | High humidity increases disease pressure, especially Sigatoka risk in sensitive regions. |
| Sunlight | Balanced sunlight during growth | Watch | Low sunlight can slow development and affect fruit size, grade and filling. |
| Temperature | No extreme heat or cold stress | Stable | Temperature stress can increase curvature, reduce grade and impact shelf performance. |
| Disease pressure | Controlled through monitoring | High focus | Requires enhanced monitoring, farm controls and packing inspections to maintain consistency. |
Country updates
Key messages and customer outlook summarized from the weekly quality deck.
Shipping update
Vessel arrivals and fruit availability summary
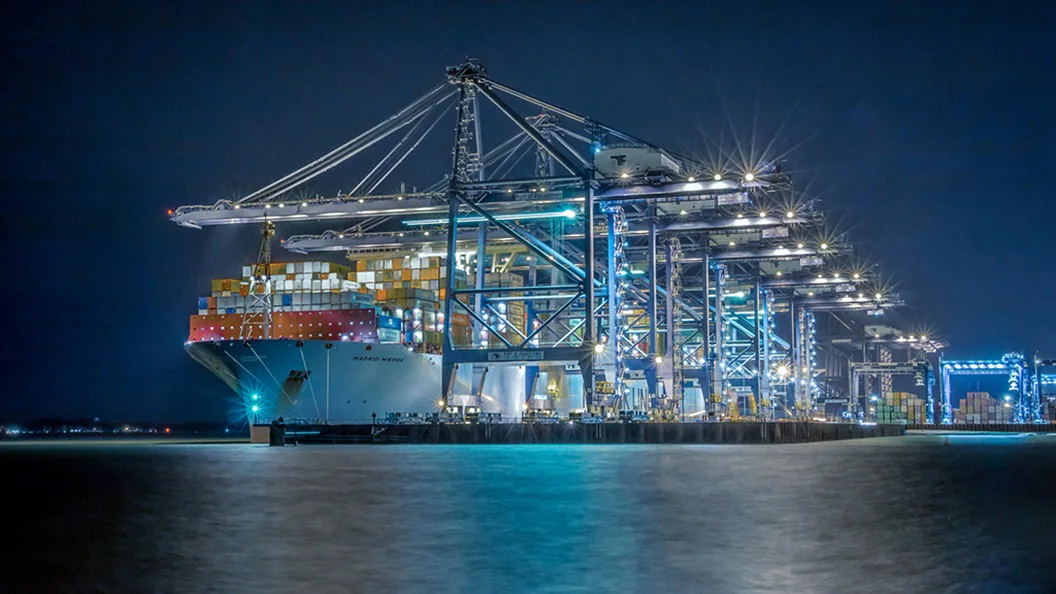
Port operations
Logistics overview for container handling and terminal readiness.
Selected European ports export view, weeks 10–22
Only these selected ports are shown for now: Dunkerque, Amberes, Rotterdam, Vlissingen, Hamburgo, Bremerhaven, Gdansk, Gdynia and Klaipeda.
Selected European ports
Selected ports by week
Weekly 22XU Boxes and Containers for only the selected ports, kept in the exact order requested.
| Week | Containers | DUNKERQUE | AMBERES | ROTTERDAM | VLISSINGEN | HAMBURGO | BREMERHAVEN | GDANSK | GDYNIA | KLAIPEDA | ||
|---|---|---|---|---|---|---|---|---|---|---|---|---|
| Week 10 | 1 371 238 | 1 041.0 | 9 | 59 20053.0 Containers | 252 862237.0 Containers | 306 261294.0 Containers | 255 0838.0 Containers | 188 926172.0 Containers | 120 927110.0 Containers | 12 27611.0 Containers | 126 738112.0 Containers | 48 96544.0 Containers |
| 11 | 1 154 387 | 874.0 | 9 | 4 3204.0 Containers | 182 883175.0 Containers | 296 457281.0 Containers | 240 06018.0 Containers | 206 057195.0 Containers | 43 45239.0 Containers | 2 2682.0 Containers | 125 604111.0 Containers | 53 28649.0 Containers |
| 12 | 1 617 228 | 1 275.0 | 8 | 109 28498.0 Containers | 281 667271.0 Containers | 331 803319.0 Containers | 249 5201.0 Containers | 228 094214.0 Containers | 234 373210.0 Containers | 00.0 Containers | 126 754112.0 Containers | 55 73350.0 Containers |
| 13 | 1 118 202 | 822.0 | 9 | 14 60413.0 Containers | 218 607211.0 Containers | 242 539232.0 Containers | 252 7241.0 Containers | 207 555201.0 Containers | 38 00635.0 Containers | 10 2069.0 Containers | 89 31679.0 Containers | 44 64541.0 Containers |
| 14 | 1 013 222 | 718.0 | 7 | 105 09294.0 Containers | 93 15691.0 Containers | 308 766293.0 Containers | 257 33415.0 Containers | 123 440114.0 Containers | 00.0 Containers | 00.0 Containers | 115 390102.0 Containers | 10 0449.0 Containers |
| 15 | 1 460 891 | 1 116.0 | 8 | 50 19045.0 Containers | 310 533298.0 Containers | 227 904218.0 Containers | 283 73022.0 Containers | 162 268152.0 Containers | 253 814228.0 Containers | 00.0 Containers | 125 604111.0 Containers | 46 84842.0 Containers |
| 16 | 1 256 299 | 941.0 | 7 | 00.0 Containers | 276 775265.0 Containers | 299 918279.0 Containers | 270 76430.0 Containers | 177 018161.0 Containers | 47 98543.0 Containers | 00.0 Containers | 130 140115.0 Containers | 53 69948.0 Containers |
| 17 | 1 425 053 | 1 091.0 | 8 | 41 48237.0 Containers | 325 048310.0 Containers | 209 971199.0 Containers | 262 21818.0 Containers | 162 339148.0 Containers | 262 997236.0 Containers | 00.0 Containers | 109 69297.0 Containers | 51 30646.0 Containers |
| 18 | 994 559 | 730.0 | 7 | 62 79056.0 Containers | 86 97990.0 Containers | 247 086234.0 Containers | 241 38617.0 Containers | 182 618174.0 Containers | 32 22029.0 Containers | 00.0 Containers | 141 480130.0 Containers | 00.0 Containers |
| 19 | 1 426 680 | 909.0 | 9 | 42 48838.0 Containers | 291 887279.0 Containers | 207 338203.0 Containers | 257 46811.0 Containers | 143 432131.0 Containers | 79 09271.0 Containers | 217 7947.0 Containers | 138 096125.0 Containers | 49 08544.0 Containers |
| 20 | 594 620 | 327.0 | 6 | 53 58048.0 Containers | 83 51180.0 Containers | 90 46185.0 Containers | 245 0224.0 Containers | 38 52635.0 Containers | 83 52075.0 Containers | 00.0 Containers | 00.0 Containers | 00.0 Containers |
| 21 | 585 669 | 323.0 | 6 | 42 44638.0 Containers | 77 68775.0 Containers | 97 88892.0 Containers | 267 98228.0 Containers | 28 49426.0 Containers | 71 17264.0 Containers | 00.0 Containers | 00.0 Containers | 00.0 Containers |
| 22 | 543 492 | 277.0 | 6 | 2 1602.0 Containers | 80 13877.0 Containers | 97 02690.0 Containers | 258 00412.0 Containers | 20 84419.0 Containers | 85 32077.0 Containers | 00.0 Containers | 00.0 Containers | 00.0 Containers |
Selected port details
Destination totals for selected ports only, not sorted by volume, but shown in the requested order.
| Port | Country | Containers | Selected Weeks | Peak week | ETA port discharge | Main vessels |
|---|---|---|---|---|---|---|
| Loading selected port details... | ||||||
Klaipeda weekly consignee breakdown
KLAIPEDA only: weekly split by consignee/receiver with 22XU Boxes, Containers, brands and estimated arrival week. ETA week is calculated as export week + 5 weeks based on 35–40 days average transit time. Total for KLAIPEDA: 413 611 22XU Boxes · 373.0 Containers · 7 consignees · weeks 10, 11, 12, 13, 14, 15, 16, 17, 19.
| Week | Estimated arrival week | Consignee / receiver | 22XU Boxes | Containers | Brands |
|---|---|---|---|---|---|
| Loading KLAIPEDA breakdown... | |||||
Selected consignee arrivals
No public consignees selected in Banana EC statistics settings.
| Port / ETA | Customer | Containers | 22XU Boxes | Brands |
|---|---|---|---|---|
| No public consignees selected in Banana EC statistics settings. | ||||
ECUADOR SPOT Price for 22XU USD/box
| Date | Spot Price | Difference |
|---|---|---|
| 08.06.2026 | $6,00 | -0,50 ⌄ |
| 06.06.2026 | $6,50 | -0,30 ⌄ |
| 05.06.2026 | $6,80 | -0,20 ⌄ |
| 04.06.2026 | $7,00 | 0,00 ● |
| 03.06.2026 | $7,00 | 0,00 ● |
| 02.06.2026 | $7,00 | 0,00 ● |
| 01.06.2026 | $7,00 | 0,00 ● |
| 30.05.2026 | $7,00 | 0,00 ● |
| 29.05.2026 | $7,00 | 0,00 ● |
| 28.05.2026 | $7,00 | 0,00 ⌃ |
Cost calculation scenarios
Indicative destination calculation based on average Spot Price, export cost, sea freight, exchange rate and local destination charges.
| Destination | Transit Time | FOB / C&F Price | T1 / T2 Price |
|---|---|---|---|
| Ecuador - Antwerp | 22-25 days (average 24 days) | FOB: 0.00 USD C&F: 0.00 USD | T1: 0.00 € T2: 0.00 € |
| Ecuador - Hamburg | 29-32 days (average 31 days) | FOB: 0.00 USD C&F: 0.00 USD | T1: 0.00 € T2: 0.00 € |
| Ecuador - Klaipeda | 36-40 days (average 38 days) | FOB: 0.00 USD C&F: 0.00 USD | T1: 0.00 € T2: 0.00 € |